Difference in Meas Q between calculations of flow WinRiverI ? vs WinRiverII/Qrev

Untitled Forums International Hydrometry Network Flow Measurements ADCP Difference in Meas Q between calculations of flow WinRiverI ? vs WinRiverII/Qrev

  • Creator
    Topic
  • #343
    AvatarÅsa Högblom
    Participant

      Hi all,

      I´m looking at some flood-gaugings that were made in 2007 at one of my stations in the southern part of Sweden. Both measurements were made with a RioGrande.

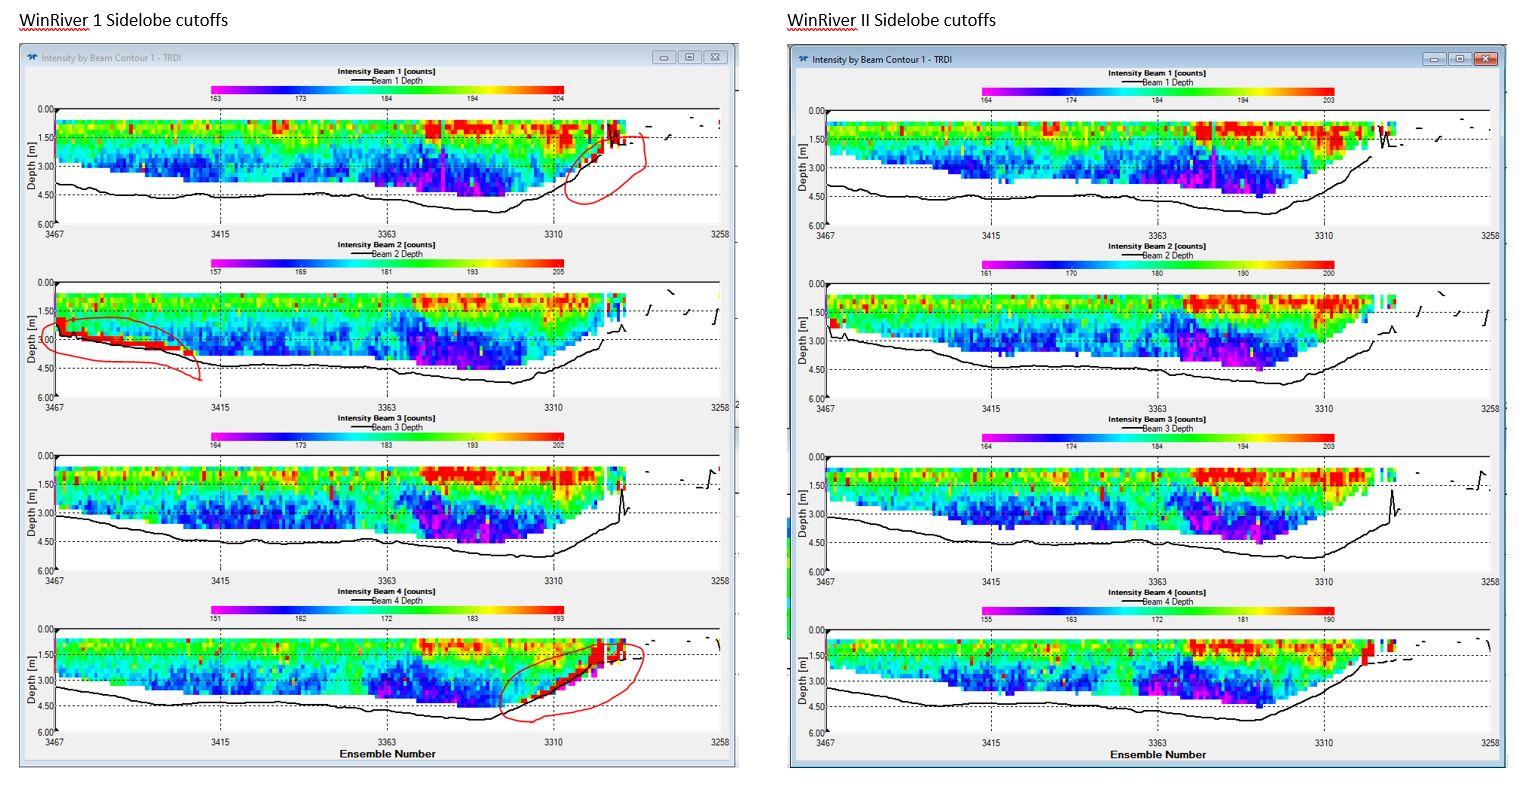
      The result that QRevInt gives is about 2% less than the reported value in our database for the gauging with the largest flow (2007-07-10), and about 5% less for the next largest flow (2007-07-11). The difference between Total Qs is probably mainly due to different extrapolation methods and exponents. But there is quite a large difference in the reported Measured Q and the Measured Q that WinRiver II and QRevInt calculates. How can this be? Were the calculations made differently with WinRiver I?

      Can anyone help me solve this mystery? I don´t have the ability to run the measurement in WinRiver I here at SMHI (the software is too old for my computer). Attached are Excel-sheets with the reported gaugings and newly created mmt-files together with the original files for each measurement.

      Attachments:
      You must be logged in to view attached files.
    Viewing 2 reply threads
    • Author
      Replies
      • #345
        AvatarJeffDH
        Participant

          Hi Asa.  You have an advantage on me as I have never used WinRiver I!!!  But yes, WinRiver I used a less conservative sidelobe cutoff calculation based (I think) on the average depth rather than the individual beam depths,   The results are often acceptable but you can never tell when there might be bottom-return base bias in the velocity data, nor how much it might impact the discharge calculations.

          The current version of WinRiver II allows you to select the WinRiver 1 style sidelobe cutoff calculations – be warned, this is a program level setting that will impact all measurements, not one that can be changed for a single measurement.  To select this setting, go to File, Properties, General Configuration, and select the checkbox for ‘WinRiver I Sidelobe Calculations’.  When I do this for the Molholm000r measurement, I get an average measured Q of 61.732, precisely matching the value in your spreadsheet.  If you do this, don’t forget to change that checkbox back when finished….

          The impact of this change, and the areas near the bottom where sidelobe contamination is likely present, can be visualized by viewing the ‘Intensity by beam’ contour plot.   I’ve attached a comparison graphic showing them side by side, with the areas of probable sidelobe contamination circled in red for the WinRiver I version.

          Hope this helps.  Jeff

          WR1 vs 2


        • #349
          AvatarÅsa Högblom
          Participant

            Thank you Jeff, that was really helpful! I didn´t know that feature exist in WinRiverII. The sidelobe interference seem to explain the difference in Measured Q.
            I must admit I haven´t used WinRiverI either. I´m working with the rating curve for this station and became curious about some measurements that were made at the site before I started working for SMHI.
            Thanks again!

          • #354
            Avatarkevinaoberg
            Participant

              I think that Jeff describes it well.  A bit more detail is provided in https://hydroacoustics.usgs.gov/memos/OSW2009-02.pdf.  I have pasted in the pertinent wording below.

              For each ensemble, WinRiver calculates a depth below which velocities measured by the ADCP are not used due to possible errors caused by side-lobe interference. This depth is referred to as the side-lobe cutoff. In previous versions of WinRiver (2.02 or earlier) the sidelobe cutoff was calculated as 6% of the depth, computed as the mean of all valid beam depths for an ensemble (figure 1a). The new side-lobe cutoff is calculated as 6% of the shallowest beam depth in an ensemble (figure 1b). For example, the side lobe cutoff computed for ensemble 78 in figure 1 for prior versions of WinRiver II is 2.4 ft. The beam depths measured for this ensemble were 1.9, 3.5,  3.3, and 1.7 ft. The new side lobe cutoff, computed using WinRiver II version 2.03 and 2.04 is 1.6 ft. The change in the side-lobe cutoff may result in fewer valid depth cells in ensembles near sloping banks and in cross sections with irregular or rough streambeds. As a consequence, the middle (measured portion of the cross-section) discharge will decrease and the bottom (unmeasured or extrapolated portion of the cross-section) discharge will increase. 

              OSW has used the new version of WinRiver II to reprocess discharge measurements from Oberg and Mueller (2007) as well as other available measurements. Based on the discharge measurements reviewed to date, the new side-lobe cutoff has resulted in a median difference in discharge of +0.5 percent. The typical change in discharge was less than 1 percent. However, for about 4 percent of the discharge measurements reviewed the discharge changed by more than 5 percent. The largest changes were found for measurements made in shallow uneven cross sections that would typically be considered poor measurement sections. These cross sections are characterized by mean differences of beam depths for individual ensembles ranging from 17 to 32 percent.

              Measurements collected in the 2009 Water Year with a mean difference of beam depths in individual ensembles exceeding 15% or a mean number of valid depth cells per ensemble less than 4 must be reprocessed using version 2.04.

              Attachments:
              You must be logged in to view attached files.
          Viewing 2 reply threads
          • You must be logged in to reply to this topic.